
Welcome to the world of precision agriculture, where data isn’t just numbers, but the key to unlocking unprecedented farm potential. In today’s dynamic agricultural landscape, making informed decisions is paramount for success. This isn’t just about guessing anymore; it’s about leveraging powerful tools that transform raw information into actionable insights. Our focus today is on two pillars of this data revolution: soil performance dashboards and crop performance dashboards. Together, they offer a holistic view of your farm’s health and productivity.
This article will delve into the unique characteristics, powerful features, and tangible benefits of each dashboard type. We’ll explore how these agri data insights are revolutionizing farming, from optimizing resource use to boosting profitability. Get ready to discover how these digital tools can help you cultivate a smarter, more sustainable, and highly productive agricultural future. It’s time to transform your farm performance data into a strategic advantage.
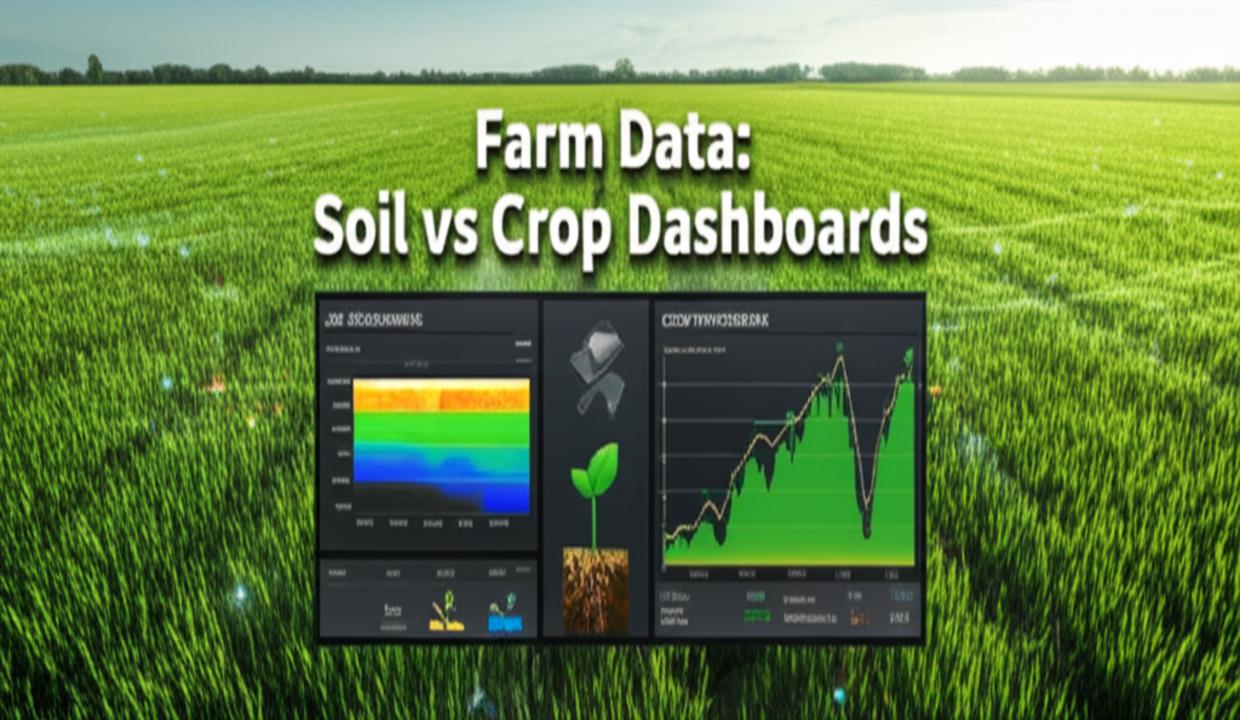
Main Highlights: Agri Data-Driven Insights: Soil vs Crop Performance Dashboards
At their core, agricultural data dashboards are sophisticated systems designed to collect, process, and visualize various farm-related data points. Imagine having a control center that aggregates everything from the moisture content in your soil to the yield of your crops, all presented in an easy-to-understand format.
These powerful tools take complex information—like soil properties, weather patterns, and crop growth stages—and turn it into clear, actionable intelligence. They empower farmers and agronomists to make precise decisions, moving away from guesswork towards data-backed strategies.
A key distinction lies in their primary focus. Soil performance dashboards concentrate on the foundational elements beneath your feet, while crop performance dashboards zero in on the output and financial returns of your hard work. Both are vital, but they answer different critical questions for effective farm management.
Soil Performance Dashboards: Unearthing Hidden Potential
Understanding your soil is the first step towards a healthy harvest. Soil performance dashboards are specifically designed to monitor and interpret the vital statistics of your land. They provide a window into the unseen world beneath your crops, giving you critical insights into their growth environment.
Key Features of Soil Insights
- Visualization of key soil health indicators such as nutrient content, moisture levels, pH balance, and soil texture. This helps you grasp the intricate composition of your fields.
- Real-time monitoring capabilities for soil moisture and other conditions, which are indispensable for precise irrigation management and preventing water waste.
- Seamless integration with advanced satellite and sensor data. This allows for highly precise soil mapping and detailed analysis of variability across your entire farm, highlighting areas needing specific attention.
- Sophisticated predictive modeling that assesses soil suitability for various crop types. These models also guide optimal fertilization strategies, ensuring nutrients are applied exactly where and when they are needed.
Benefits of Focusing on Soil Data
By providing a clear picture of your soil’s needs, these dashboards enable significant cost reductions. You can apply fertilizers and water with surgical precision, reducing overuse and minimizing environmental impact. This targeted approach not only saves money but also promotes greater sustainability.
Furthermore, robust soil data is fundamental for improving crop yield optimization. When you know your soil’s exact nutrient profile and moisture levels, you can tailor your planting, fertilization, and watering schedules for maximum efficiency and productivity. This proactive management prevents nutrient deficiencies or water stress before they impact your harvest.
Crop Performance Dashboards: Harvesting Success Metrics
Once your crops are growing, it’s crucial to track their progress and evaluate their economic output. Crop performance dashboards shift the focus from the ground up to the plants themselves, providing comprehensive views of yield, revenue, and profitability. They are essential tools for evaluating and enhancing your overall agricultural output.
Key Features of Crop Analytics
- Detailed tracking of crop yield distribution, broken down by type, specific field locations, and across different seasons. This helps identify your most productive areas and crops.
- In-depth profitability analysis, which can be tailored by individual farmers or across multiple farms. This feature helps uncover high-performing areas and highlights opportunities for improved financial returns.
- Comprehensive revenue and cost trend analysis. This incorporates crucial factors like fertilizer usage and planted area to give you a clear financial overview of your operations.
- Interactive filters that allow for detailed data exploration. You can filter by county, specific crop type, and input usage, empowering you to dive deep into your farm performance data.
- Dynamic visualizations including bar charts for top performers, line graphs for trend analysis, and pie charts for yield share, making complex data easy to digest.
Benefits of Tracking Crop Performance
These dashboards directly contribute to enhanced profitability. By analyzing market trends and historical crop performance, you can make informed decisions on optimal crops to plant and the best times to sell. This strategic insight maximizes your revenue potential.
Moreover, understanding your crop’s performance helps identify inefficiencies in your operations. For example, if a specific crop type consistently underperforms in a certain area, the dashboard can flag this, prompting further investigation into soil conditions or management practices. This loop of insight and action is vital for continuous improvement and sustained crop yield optimization.
The Power of Integration: Soil and Crop Synergy
While soil and crop dashboards offer distinct advantages, their true power lies in their integration. Combining insights from both allows for a comprehensive, closed-loop system of agricultural intelligence. This synergy forms the backbone of modern precision agriculture.
Imagine seeing a dip in crop yield data directly correlated with low soil moisture readings in the same plot. This integrated view allows you to quickly identify problems, implement targeted solutions, and measure the impact of your interventions. It moves you beyond isolated data points to a holistic understanding of your farm’s ecosystem.
By leveraging both types of dashboards, farmers gain a powerful decision-making framework. This framework supports everything from pre-planting soil amendments to real-time irrigation adjustments and post-harvest yield analysis, all contributing to superior agri data insights and sustainable farming practices.
Recent Breakthroughs in Agricultural Analytics
The field of agricultural analytics is constantly evolving, with significant advancements making data-driven farming more accessible and powerful than ever before. These breakthroughs are transforming how farmers interact with their land and make critical decisions.
Modern visualization tools, such as Power BI, are now empowering stakeholders at all levels to make detailed, data-driven decisions on both crop and soil management. These platforms offer intuitive interfaces that simplify complex data, making it easier for users without prior analytic expertise to gain valuable insights. For an example of how agricultural analytics is being applied strategically, you can explore platforms designed for agricultural business intelligence.
Predictive models are also becoming increasingly accurate. By integrating diverse datasets—including soil composition, real-time weather conditions, and extensive historical crop data—these models are vastly improving the precision of yield forecasting and soil health assessment. This means farmers can anticipate challenges and opportunities with greater certainty, leading to better outcomes and contributing significantly to improved yield forecasting accuracy.
Furthermore, the combination of high-resolution satellite imagery with granular real-time sensor data is enabling truly precise farming. This integration allows for optimized input application, from fertilizers to pesticides, significantly reducing environmental impact and maximizing resource efficiency. This holistic approach supports more sustainable agricultural practices.
Real-World Applications: Data in Action
These sophisticated dashboards are not just theoretical concepts; they are actively being used by farmers and agricultural organizations worldwide to achieve tangible results. Their practical applications demonstrate their immense value in modern agriculture.
For instance, one notable application is InetSoft’s Agricultural Dashboard. This powerful tool integrates national crop statistics with localized weather and pesticide usage data. It’s designed to help users, including policymakers, make strategic decisions without needing extensive prior analytic expertise, simplifying complex agricultural planning.
Another excellent example comes from Folio3 AgTech, which assists crop growers in visualizing soil conditions directly alongside crop health metrics. This combined view is crucial for optimizing irrigation schedules and fine-tuning fertilization plans, directly leading to improved yields and more efficient resource utilization. This approach highlights the importance of effective data visualization in agriculture for better decision-making.
Moreover, Power BI dashboards have been successfully applied to track farmer profitability, analyze revenue trends, and monitor crop performance across multiple farms. Such applications provide invaluable support to farmer organizations and policymakers, aiding in strategic planning and resource allocation at a broader scale.
Benefits and Future Potential for Farming
The adoption of agri data insights through performance dashboards offers a multitude of benefits that extend across the entire farming operation. These advantages are crucial for modern agricultural success and sustainability.
Key Benefits of Data-Driven Farming:
- Improved Crop Yields: Data-driven insights allow for precisely timed planting, fertilization, and watering based on real-time soil and crop data. This optimizes growth conditions and boosts overall productivity.
- Cost Reduction: By guiding targeted input application (e.g., nitrogen fertilizer) based on specific soil nutrient data and crop requirements, these systems significantly reduce waste and input costs. This makes a strong business case for data-driven farming.
- Enhanced Profitability: Analyzing market trends alongside yield data helps farmers decide optimal crops to plant and the best times to sell, thereby maximizing revenue and farm profitability.
- Environmental Sustainability: Data insights lead to a reduced overuse of precious resources like water, fertilizers, and pesticides. This contributes to healthier ecosystems and more sustainable farming practices.
Future Potential and Current Limitations:
The future of soil crop dashboards looks incredibly promising, with significant potential for even greater precision and automation. Further integration of cutting-edge AI technologies and sophisticated IoT sensor networks is expected to yield increasingly precise, real-time monitoring capabilities, leading to hyper-localized farm management.
However, wider adoption of these transformative technologies still faces hurdles. Data accessibility, particularly for smallholder farmers, remains a challenge. Ensuring that these powerful dashboards are user-friendly and intuitive is also crucial for broader acceptance. Furthermore, standardizing diverse data formats and effectively aggregating varied data sources for seamless analysis continues to be an ongoing challenge in the agricultural tech space.
What’s New in 2025?
The pace of innovation in agricultural analytics is rapid, and 2025 promises even more advancements. A significant development this year is the continued emphasis on practical, accessible tools for farmers.
A recent July 2025 tutorial exemplifies this trend by showcasing how to build a Crop Analysis Dashboard with Power BI. This resource highlights interactive features that allow users to filter data by county, specific crop type, and fertilizer usage. Such detailed filtering unlocks invaluable insights into profitability and yield distribution across diverse agricultural operations. This type of readily available guidance makes advanced analytical tools more approachable for everyone in the farming community. For a practical example, you can refer to this Power BI agricultural data tutorial.
Pros and Cons
Adopting data-driven approaches like soil crop dashboards offers significant advantages, but also comes with its own set of considerations. Understanding both sides helps in making an informed decision about integrating these technologies into your farming operations.
| Pros of Data-Driven Farming | Cons/Challenges |
|---|---|
| Significantly improved crop yields due to precise management. | Initial investment cost for sensors, software, and training can be high. |
| Reduced operational costs through optimized input usage (water, fertilizer). | Requires a learning curve for farmers to effectively use and interpret dashboards. |
| Enhanced profitability by guiding strategic crop choices and selling times. | Data standardization and integration across diverse sources remain complex. |
| Greater environmental sustainability from minimized resource waste. | Data accessibility can be a barrier, especially for smallholder farmers. |
| Better risk management due to predictive insights on weather and soil. | Reliance on stable internet connectivity and reliable sensor networks. |
FAQ
-
What is the primary difference between soil and crop performance dashboards?
Soil performance dashboards primarily focus on visualizing and monitoring subsurface conditions like nutrient levels, moisture, and pH. Crop performance dashboards, on the other hand, track above-ground metrics such as yield distribution, revenue, and profitability of specific crops. They offer complementary but distinct views of farm health.
-
How do these dashboards contribute to crop yield optimization?
Both dashboards contribute significantly. Soil dashboards ensure optimal growing conditions by guiding precise fertilization and irrigation. Crop dashboards help optimize yield by identifying high-performing areas and crops, analyzing cost-effectiveness, and enabling data-driven decisions for future planting strategies.
-
Are these agricultural analytics tools difficult for an average farmer to use?
While some initial learning may be involved, recent breakthroughs in visualization tools like Power BI have made agricultural dashboards much more user-friendly. Many platforms are designed with intuitive interfaces, reducing the need for extensive prior analytic expertise and making them accessible to a wider audience.
-
What kind of data sources do these dashboards integrate?
These dashboards typically integrate a wide array of data, including real-time sensor data (for soil moisture, nutrients), satellite imagery (for precise soil mapping and crop health), historical yield data, weather patterns, input usage (fertilizers, pesticides), and financial metrics like revenue and costs. This comprehensive integration provides rich agri data insights.
-
Can these dashboards help with environmental sustainability?
Absolutely. By providing precise data on soil needs and crop requirements, these dashboards enable farmers to apply water, fertilizers, and pesticides only when and where they are truly needed. This targeted approach significantly reduces overuse, minimizes runoff, and lowers the environmental footprint of agricultural operations, promoting eco-friendly practices.
Conclusion
In summation, the distinction between soil performance dashboards and crop performance dashboards is crucial yet complementary. Soil dashboards provide foundational insights into the health and properties of your land, guiding essential input decisions. Crop dashboards, conversely, measure and analyze the output and economic viability of your harvest, focusing on profitability and yield success.
Embracing both types of dashboards is the cornerstone of modern precision agriculture. They empower farmers with unparalleled agri data insights, transforming traditional practices into a highly efficient, sustainable, and profitable endeavor. The future of farming is undoubtedly data-driven, and these tools are leading the way.
We hope this deep dive into soil crop dashboards has illuminated their immense potential for your farm. Do you use data insights in your agricultural practices? Share your experiences in the comments below! For more compelling articles on agricultural innovation, be sure to read other articles on our site or simply click contact us if you have any questions. #AgriTech #PrecisionFarming
Watch More in This Video
Get a closer look at building and utilizing a powerful agricultural dashboard with this insightful tutorial on crop analysis using Power BI. Learn how interactive features can unlock critical insights from your agricultural data, making complex analysis straightforward and actionable.
Disclaimer: All images and videos are sourced from public platforms like Google and YouTube. If any content belongs to you and you want credit or removal, please inform us via our contact page.